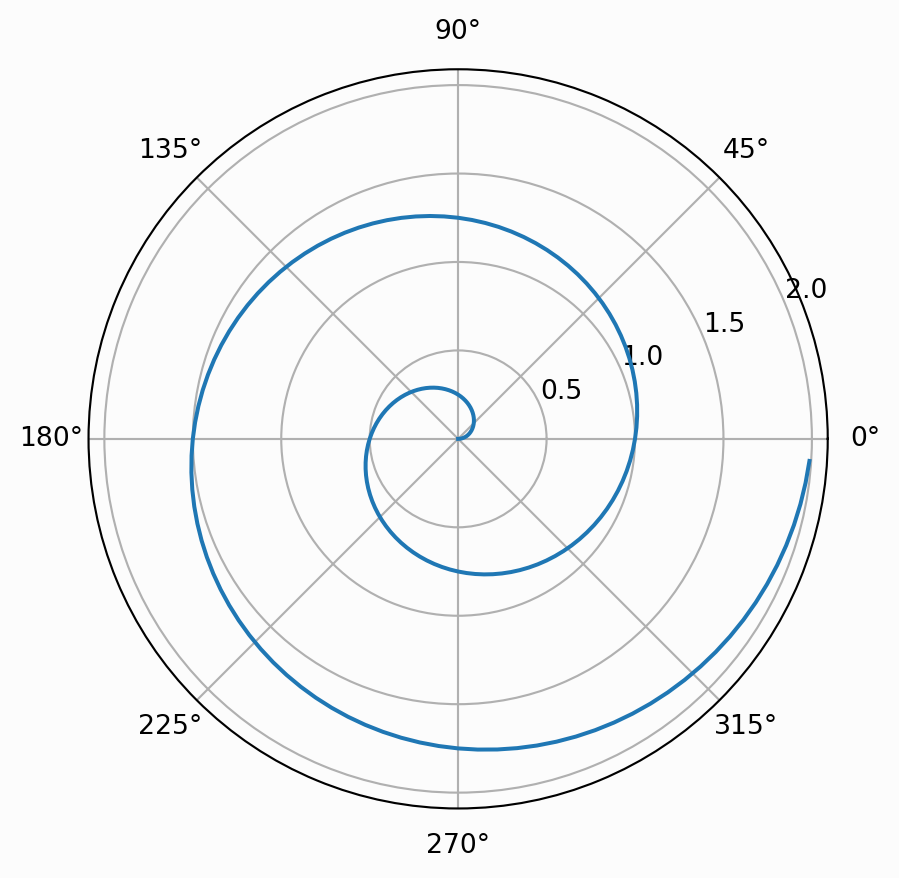
For a demonstration of a line plot on a polar axis, see Figure 1.1.
Code
import numpy as np
import matplotlib.pyplot as plt

r = np.arange(0, 2, 0.01)
theta = 2 * np.pi * r
fig, ax = plt.subplots(
  subplot_kw = {'projection': 'polar'}
)
fig.patch.set_facecolor("#fcfcfc")
ax.set_facecolor("#fcfcfc")
ax.plot(theta, r)
ax.set_rticks([0.5, 1, 1.5, 2])
ax.grid(True)
plt.show()
See Knuth (1984) for additional discussion of literate programming.
Knuth, Donald E. 1984.
“Literate Programming.” Comput. J. 27 (2): 97–111.
https://doi.org/10.1093/comjnl/27.2.97.
